Completed end-to-end case study

Poland Data Pipeline

Azure Data Engineering + BI Analyst & GIS Specialist

A production-minded data solution that transforms official Polish census and residence data into validated analytical models, an interactive Power BI report, and an ArcGIS spatial view of foreign population across Poland.

  • Azure Data Lake Gen2
  • Azure AI Translator
  • Python · Pandas
  • Power BI · DAX
  • ArcGIS for Power BI
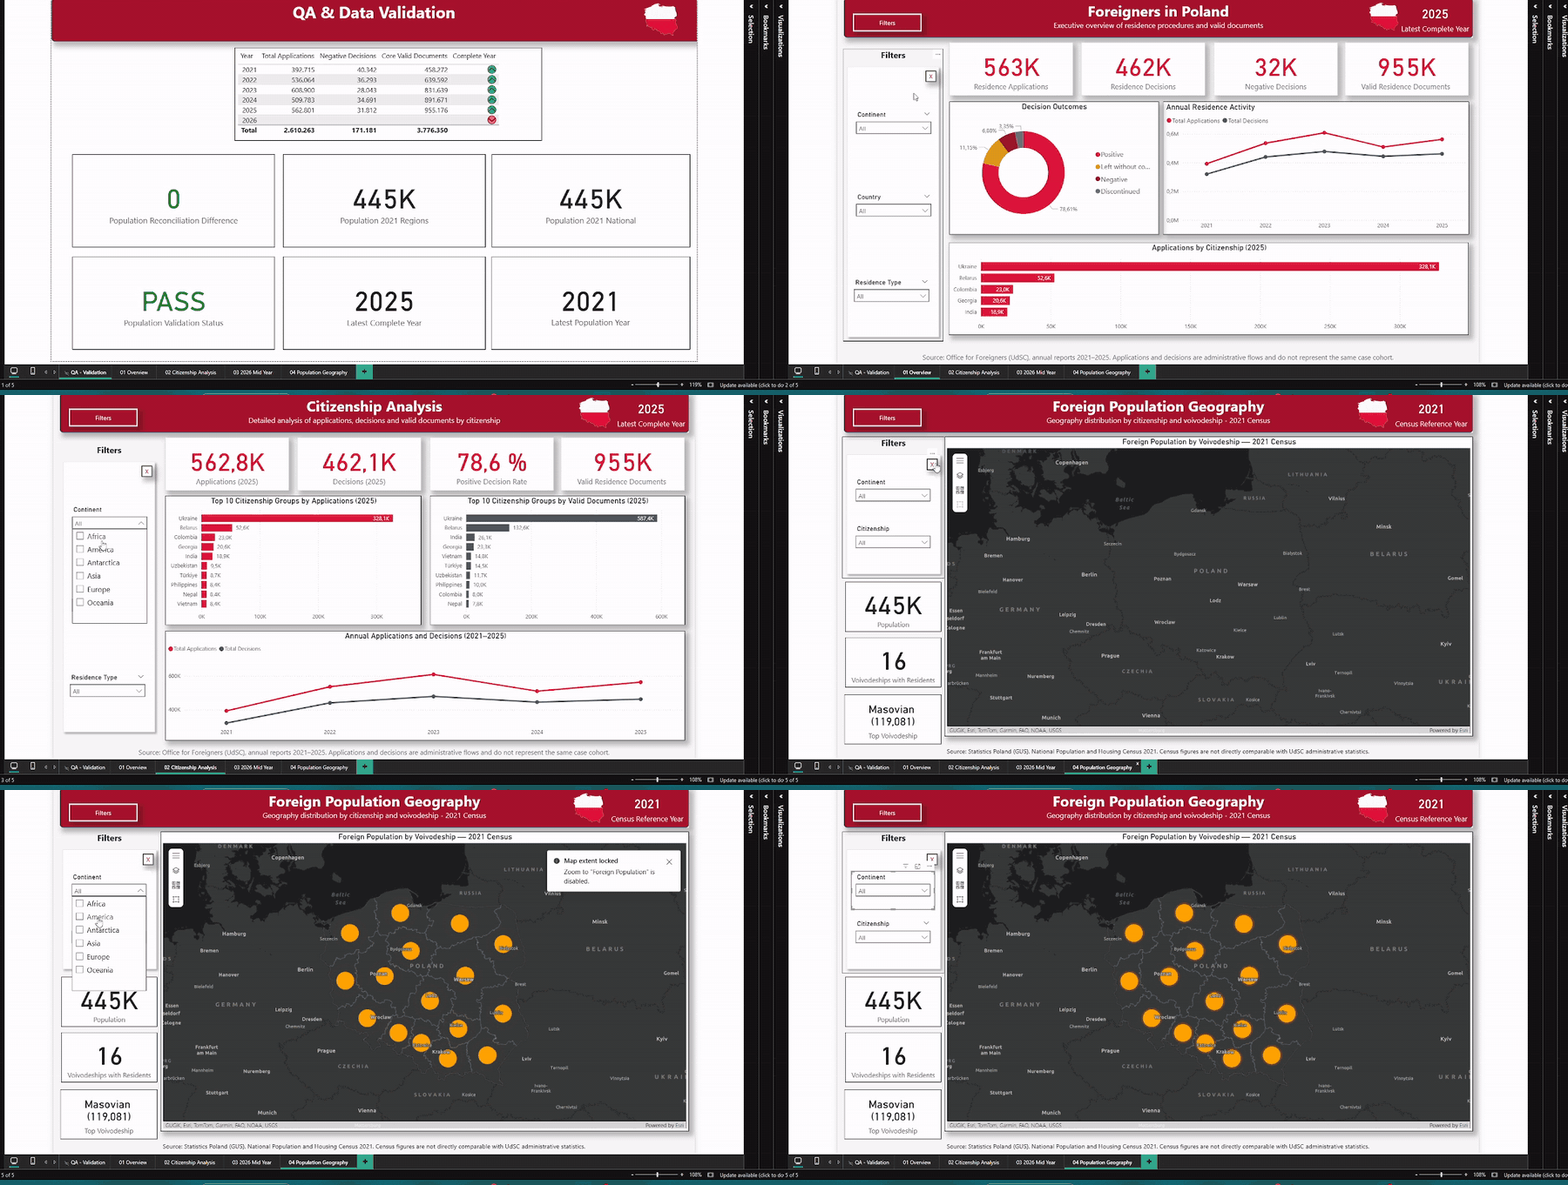
Animated preview moving through the Power BI dashboard for foreigners in Poland
Interactive dashboard4 analytical views · 1 QA page
One project
Two disciplines
2Official data systems
187Real country entities
16Voivodeships mapped
2021–H1 2026Reporting coverage

Built like a Data Engineer. Interpreted like a BI & GIS Analyst.

The value is not only the dashboard or the pipeline. It is the trustworthy connection between both.

Track A · Data Engineering

End-to-end Azure platform

API and Excel ingestion, immutable evidence, multilingual standardization, automated QA, Parquet outputs, and conformed analytical models.

  • GUS BDL REST API and UdSC workbooks
  • Raw · Silver · Gold medallion architecture
  • Azure AI Translator with local caching
  • Schema drift, keys, grains, and totals validated
Track B · BI Analyst + GIS Specialist

Power BI storytelling with ArcGIS

Semantic models, defensive DAX, executive KPIs, comparable-period analysis, and spatial exploration by citizenship and voivodeship.

  • Three purpose-built semantic models
  • Four analytical pages plus a QA page
  • ArcGIS map with contextual filtering
  • Business interpretation without mixing source meanings

From official source to spatial decision support.

Every layer has a clear responsibility: preserve, standardize, model, validate, and communicate.

01IngestGUS REST API · UdSC ExcelComplete
02RawImmutable JSON · XLSX · SHA-256Complete
03SilverClean · Translate · ValidateComplete
04GoldConformed dimensions · factsComplete
05AnalyzePower BI · DAX · ArcGISComplete
GUS · Census 2021

Usual-residence population by citizenship and sex for Poland and all 16 voivodeships.

UdSC · 2021–2026

Applications, decisions, outcomes, and valid residence documents from annual and periodic reports.

Separate models protect the meaning and grain of every measure.

Annual administrative flows, H1 comparisons, and census geography are connected—but never forced into invalid comparisons.

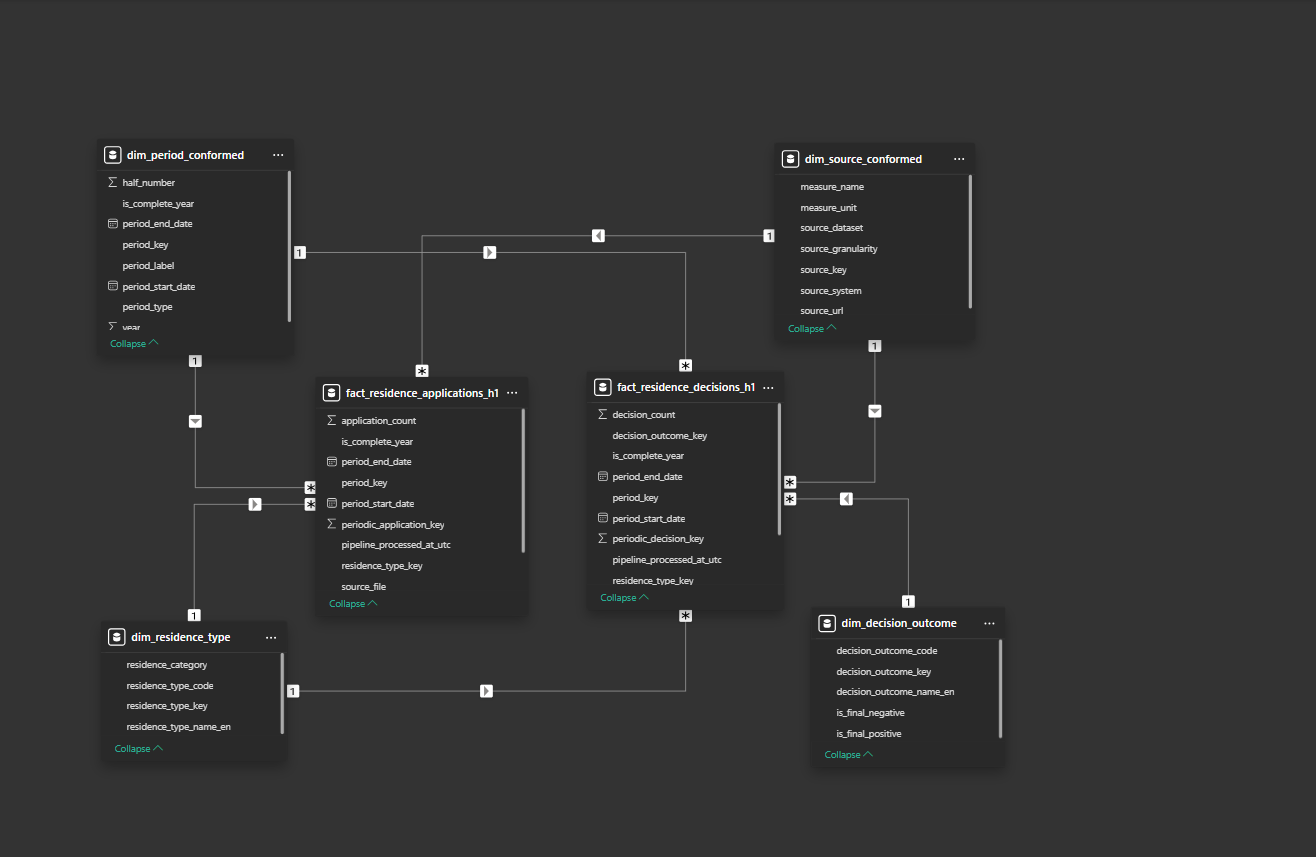
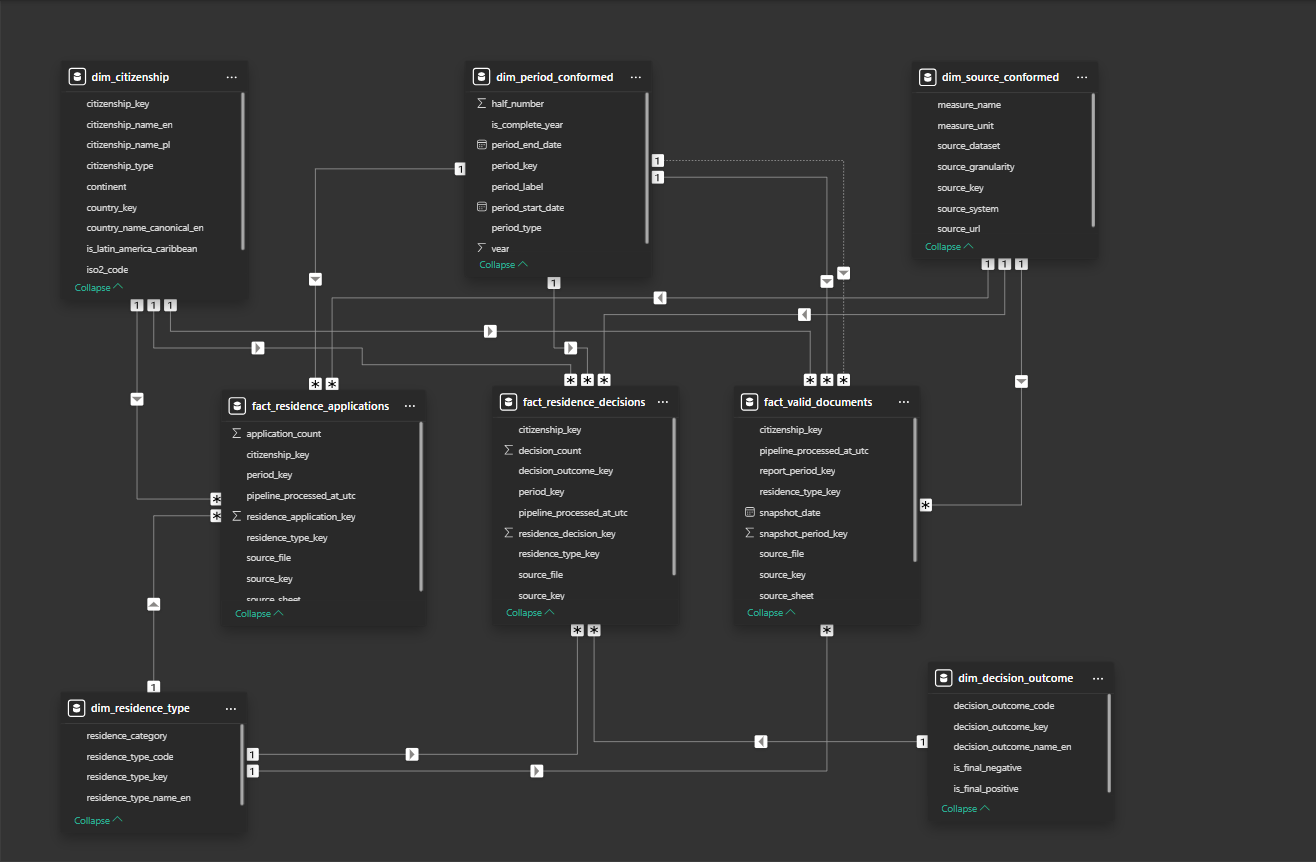
Residence analytics Power BI semantic model
Model 01

Residence analytics

A fact constellation connects applications, decisions, and valid-document snapshots to shared citizenship, period, source, residence-type, and outcome dimensions.

Mid-year comparison Power BI semantic model
Model 02

Mid-year comparison

A dedicated H1 model keeps partial-period facts separate, enabling a fair January–June 2026 versus January–June 2025 comparison.

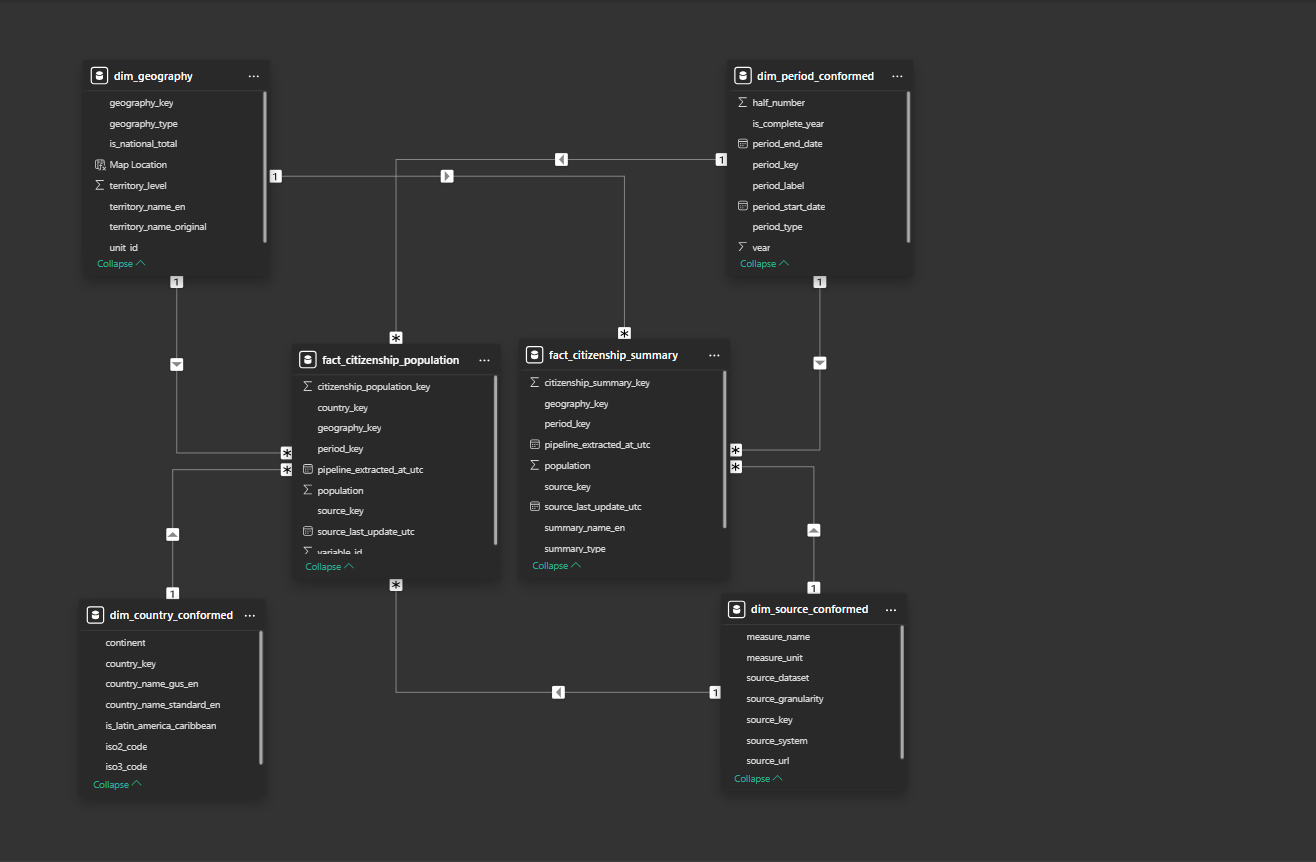
Population geography Power BI semantic model
Model 03

Population geography

Census population facts connect country, geography, period, and source dimensions while national totals remain isolated from regional detail.

Each page answers a different analytical question.

The report moves from executive context to citizenship behavior, current change, and finally the geographic pattern behind the population.

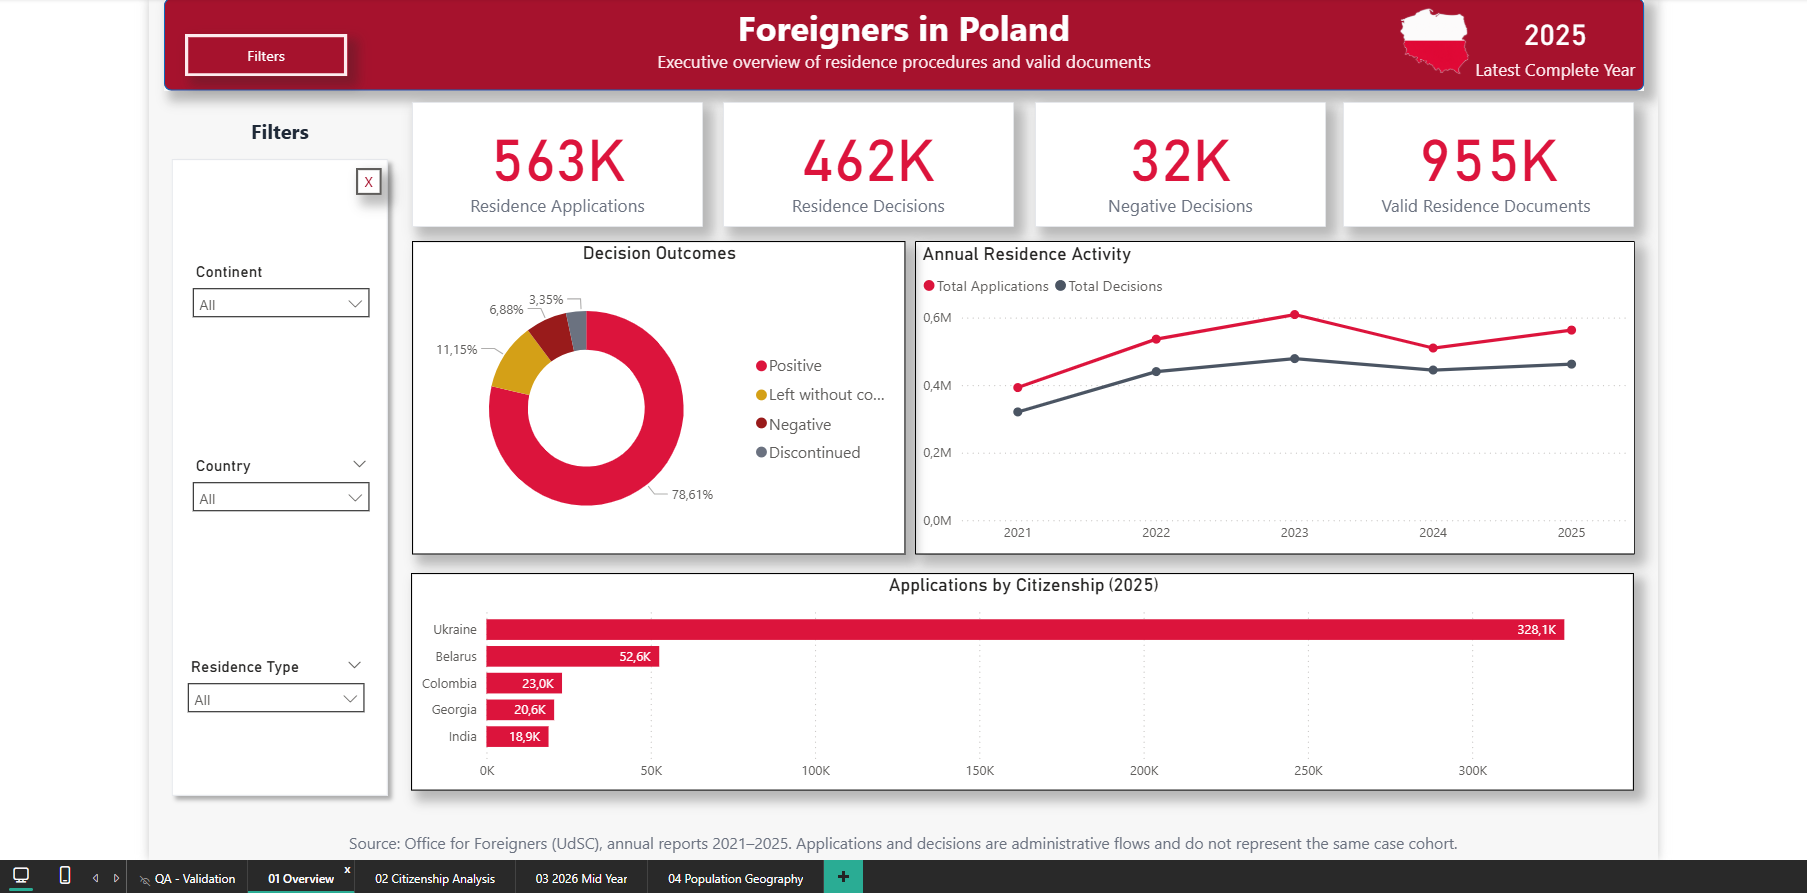
Power BI executive overview showing residence applications, decisions, outcomes, annual activity, and applications by citizenship
01

Executive overview

A decision-ready view of the latest complete year: 563K applications, 462K decisions, 32K negative decisions, and 955K valid residence documents, with annual trends and citizenship filters.

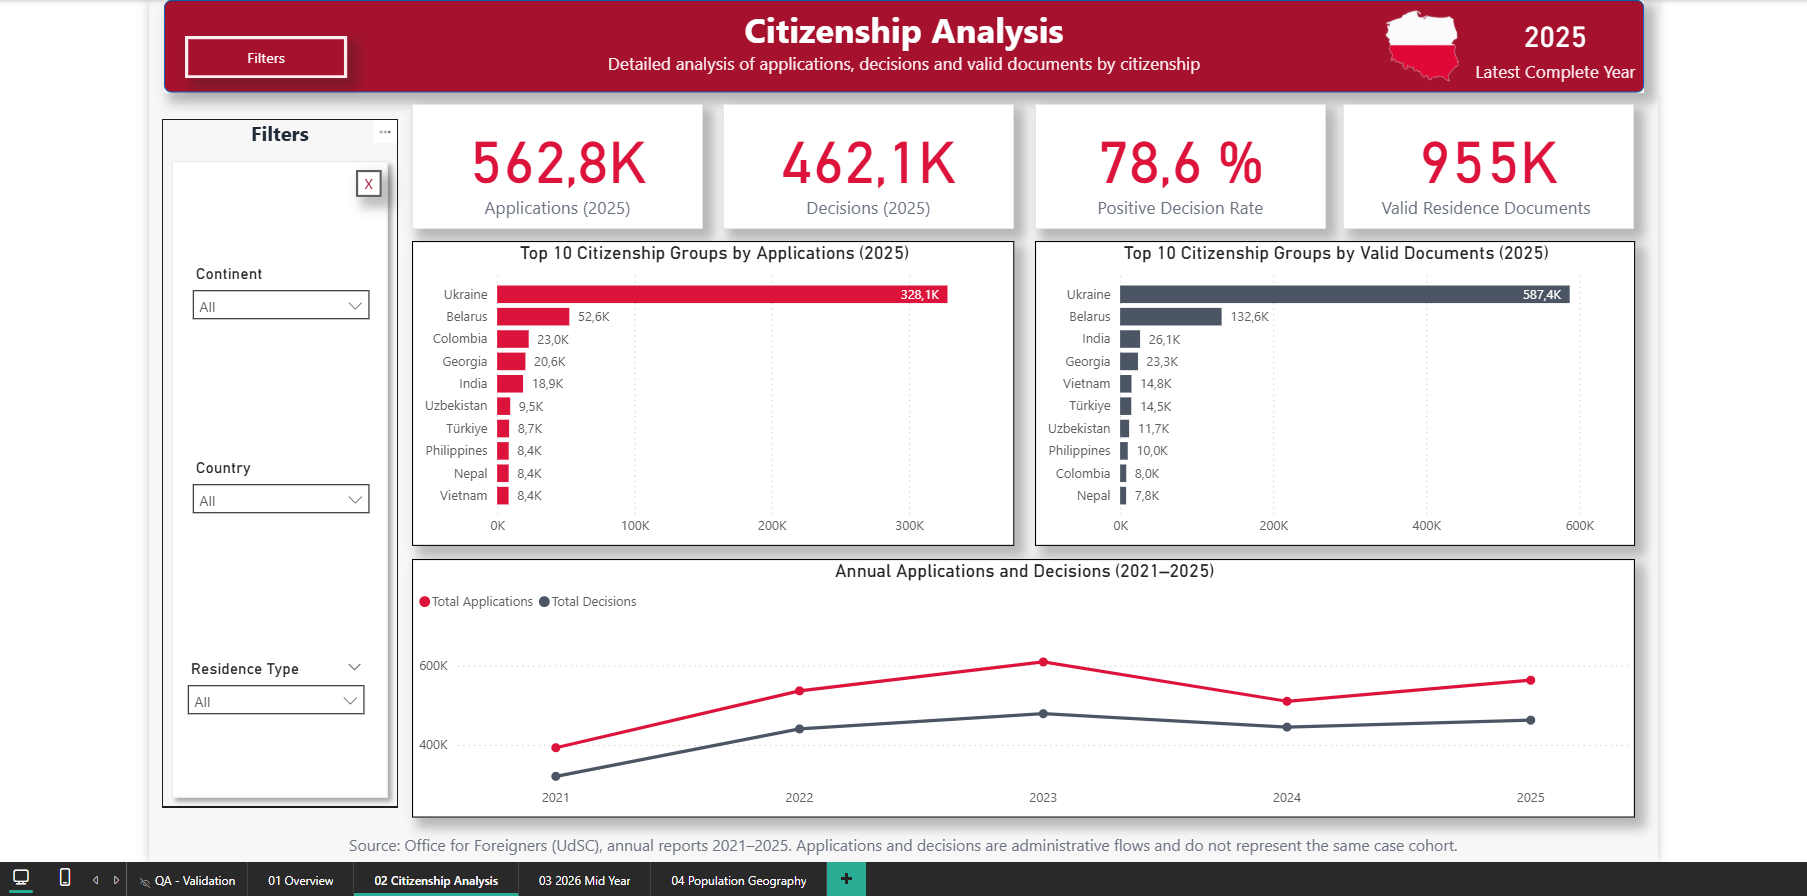
Power BI citizenship analysis with top citizenships by applications and valid residence documents
02

Citizenship analysis

Ranks citizenship groups across applications and valid documents, tracks the positive-decision rate, and lets the user move from the national picture to a selected continent, country, or residence type.

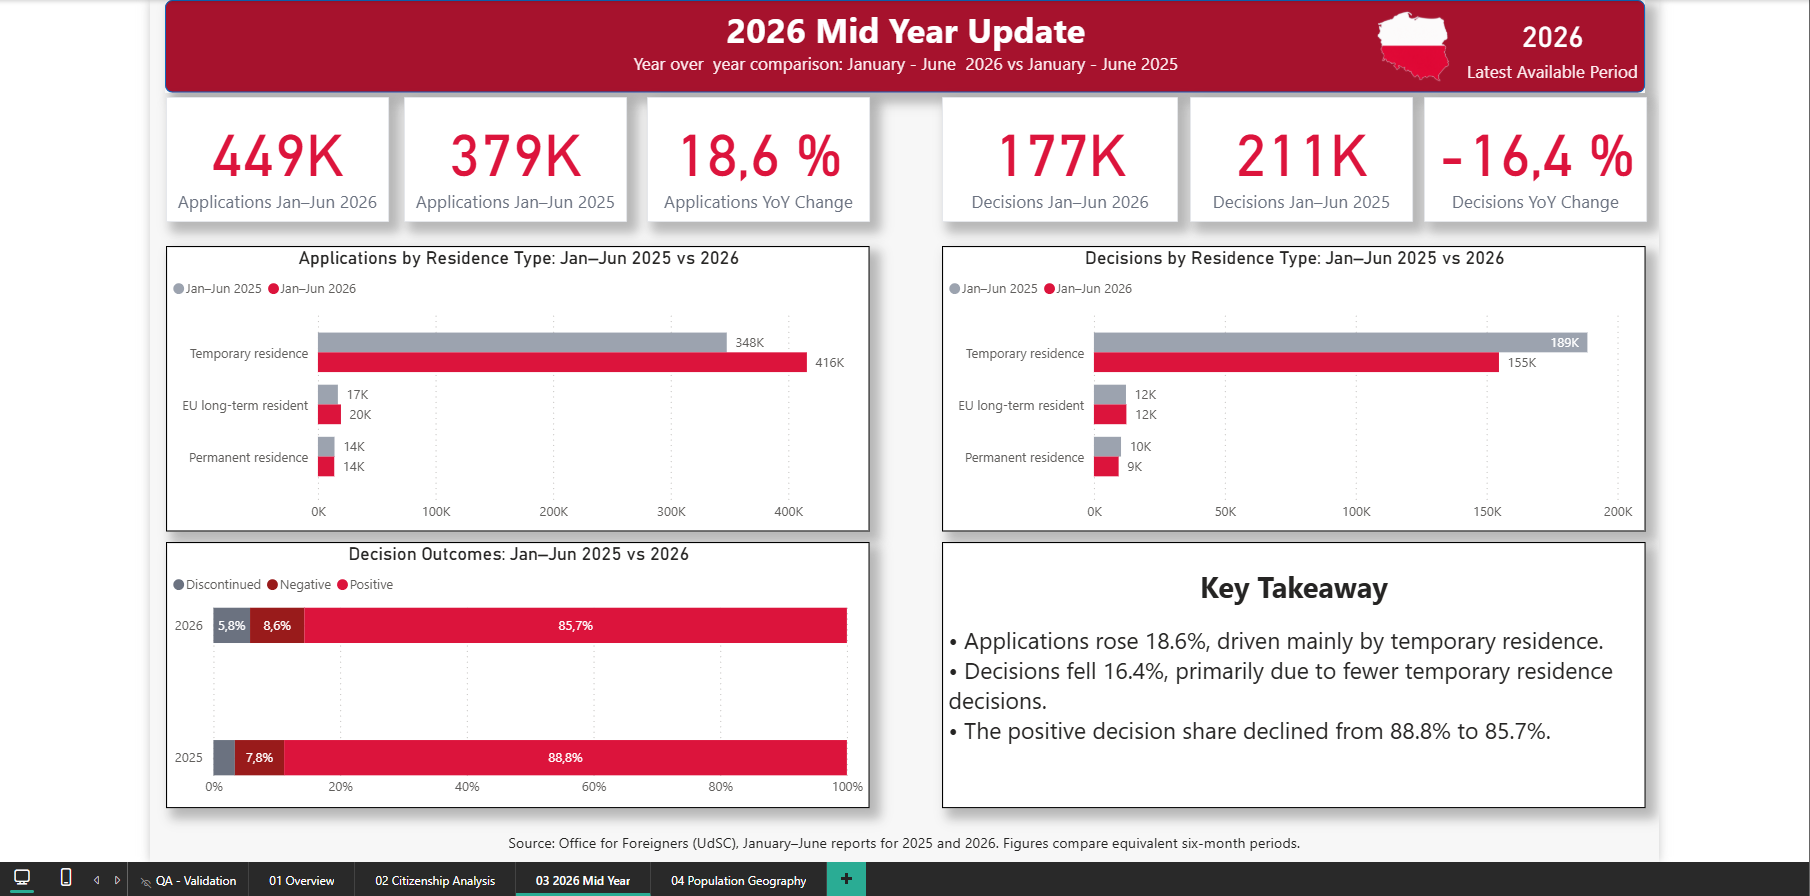
Power BI mid-year dashboard comparing residence activity in the first half of 2026 and 2025
03

2026 mid-year update

Compares equivalent six-month periods only. Applications rose 18.6% while decisions fell 16.4%, with the change decomposed by residence type and decision outcome.

The geography is part of the analysis—not decoration.

BI + GISSpatial analytics capability
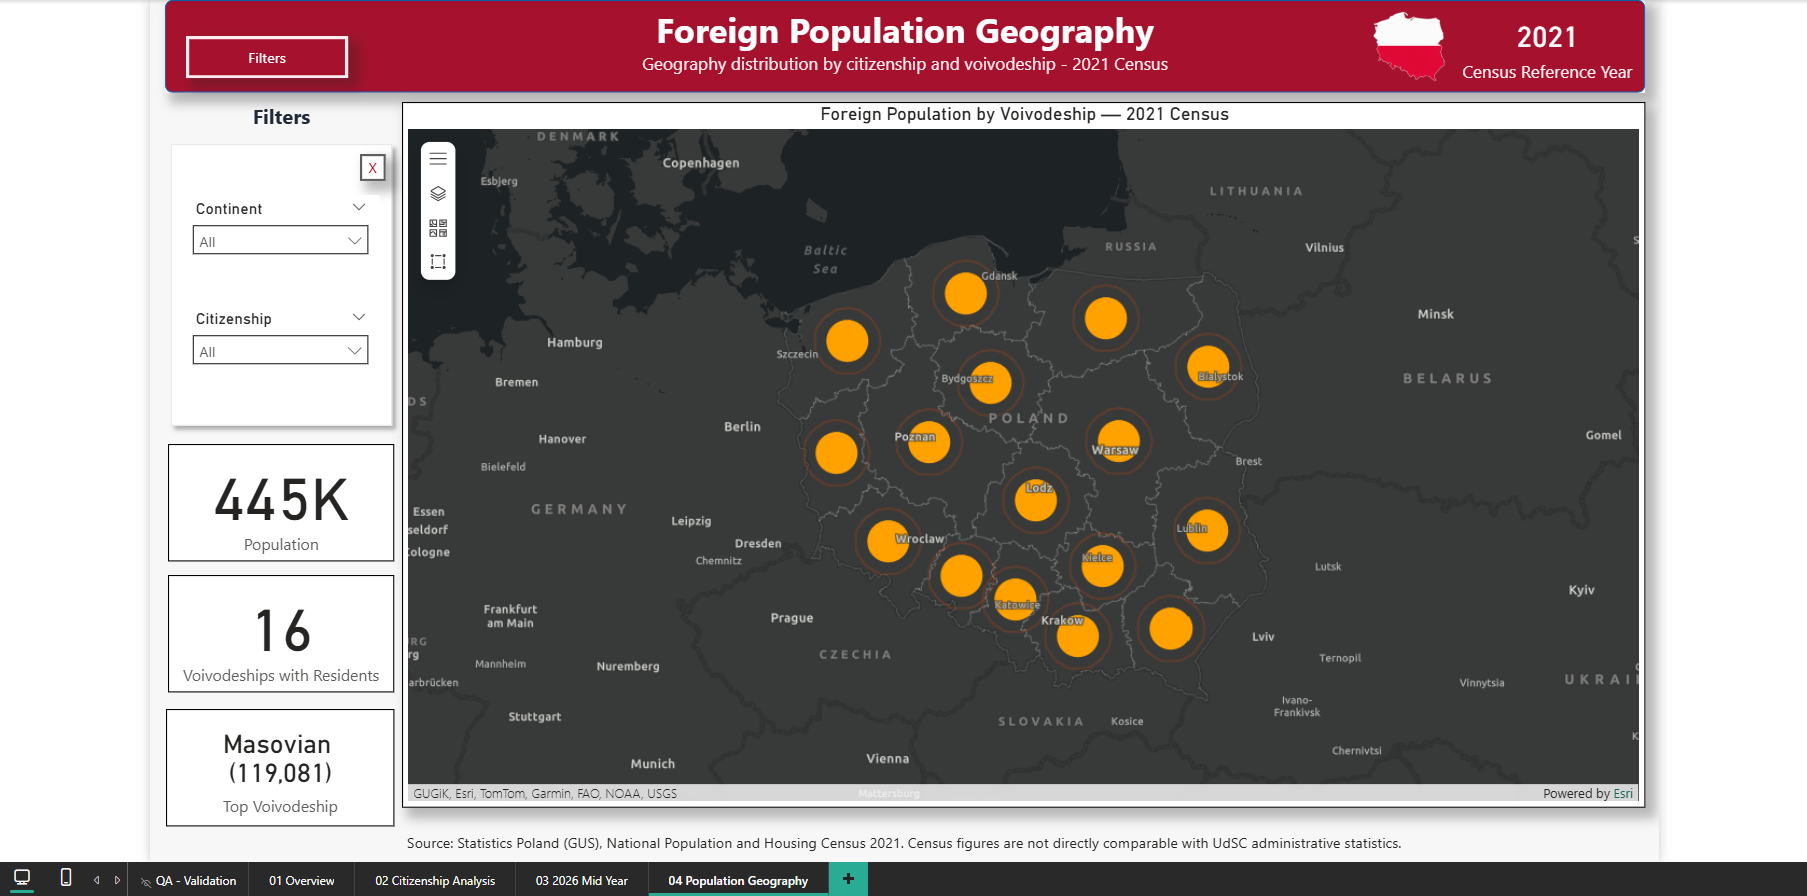
ArcGIS map in Power BI showing foreign population across Poland's 16 voivodeships
ArcGIS / Esri basemap2021 Census · GUS
Spatial question

Where do foreign residents concentrate across Poland?

The ArcGIS page maps proportional population markers for all 16 voivodeships. Continent and citizenship filters recalculate the distribution, the leading region, and the number of regions with residents in the selected context.

445K
2021 census population in the national view
16
Voivodeships available for spatial comparison
Masovian
Top region in the unfiltered view · 119,081

Methodological guardrail: GUS census population and UdSC administrative flows are intentionally presented as different statistical concepts.

Quality controls are visible in the product, not hidden in a notebook.

The dedicated QA page makes completeness, reconciliation, and period logic reviewable before a business user trusts the insights.

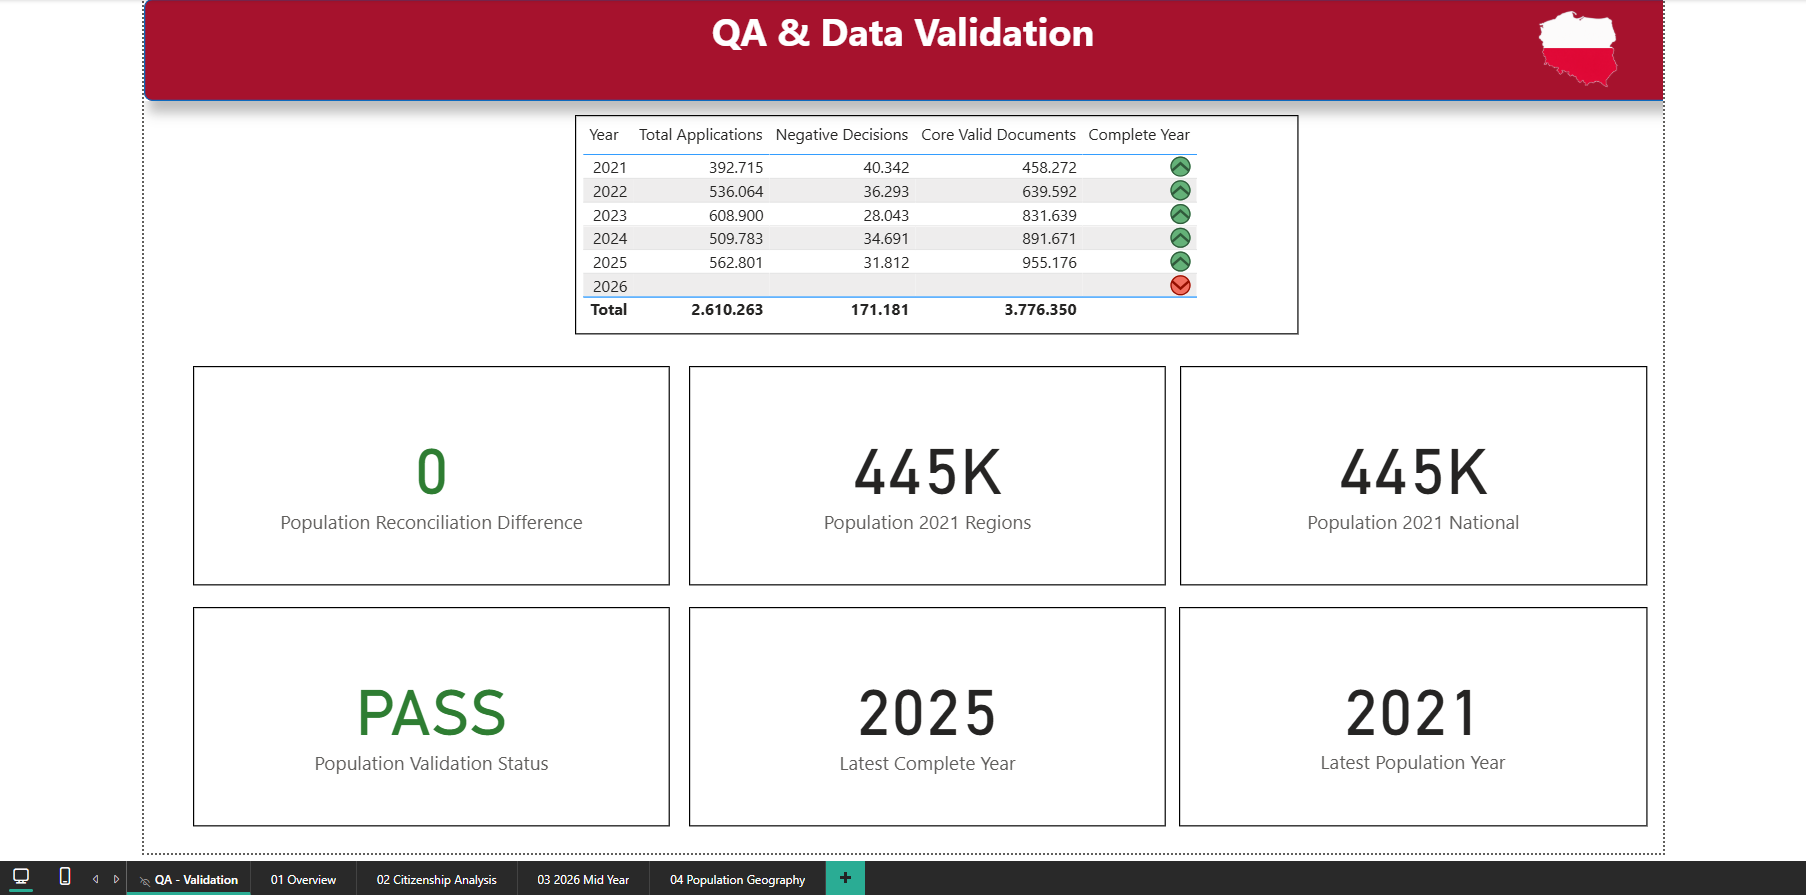
Power BI QA page showing annual completeness, population reconciliation, and validation status
Population validation: PASSReconciliation difference: 0
01

Complete-year guard

2021–2025 are flagged complete; 2026 remains partial. Annual KPI cards therefore resolve to 2025.

02

Equivalent-period logic

The H1 page compares January–June with January–June, never a partial year against a full year.

03

Population reconciliation

The sum of regional GUS values matches the national population exactly: difference 0, status PASS.

04

Source meaning preserved

Census stocks and administrative flows are labeled separately because they do not represent the same cohort.

05

Pipeline integrity

Schema drift, translations, PK/FK relationships, grains, row counts, and official totals are checked before Gold upload.

Measures encode the business rules behind the visuals.

These documented calculations provide a compact technical audit trail for annual, mid-year, and geographic logic.

DAX · 01

Latest Complete Year

Prevents incomplete 2026 data from contaminating annual KPIs.

DAX · 02

Applications H1 YoY Change

Measures like-for-like change between H1 2026 and H1 2025.

DAX · 03

Positive Decision Rate

Calculates the decision outcome rate for the latest complete year.

DAX · 04

Top Voivodeship

Finds and labels the leading region under the active GIS filters.

DAX · 05

Voivodeships with Residents

Counts regions with a positive population value in the current context.

See the report filters, pages, and ArcGIS map in motion.

A complete silent walkthrough of the working Power BI report, from QA to the geographic exploration.

Power BI Desktop walkthroughOverview · Citizenship · H1 · ArcGIS

A credible analytical product starts long before the first chart.

This project demonstrates ownership across data acquisition, engineering, modeling, QA, BI delivery, and geographic analysis.

Review the complete repository ↗